When looking for stocks to buy, I often refer to seasonality charts. I’d always look online for charts and found that I had to pay for subscriptions for services that provide me with these charts. So I decided to spend some time and created this simple Google Sheets that gives you seasonality charts. The only limitation is that it’s connected to Google Finance which limits the amount of charts you can pull per day.
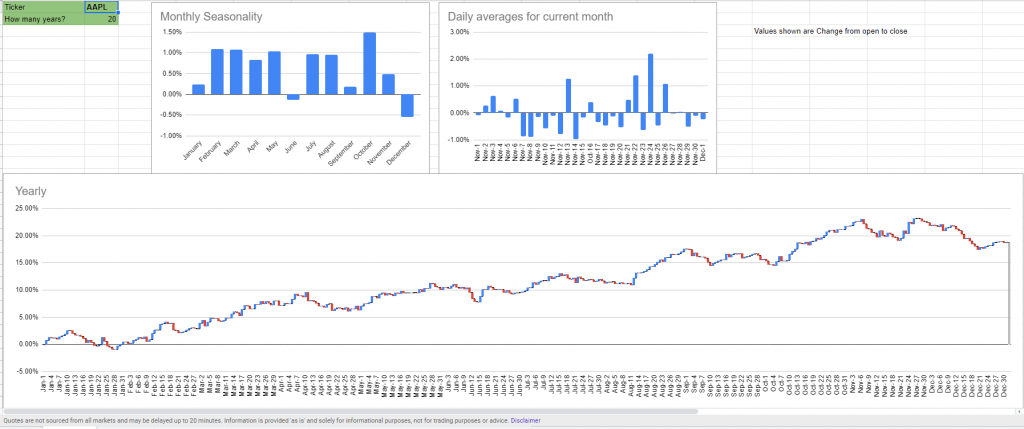

Seasonality Charts
The way it this works is that you enter the ticker on the top left and the amount of years you want to calculate for the averages. It works with Google Sheets. If you are interested you can buy it as with a one time fee of $24.95. No subscription required.
$24.95
